
ℹ️
This article was originally published on my ExcelCharts.com blog in 2013 and migrated to this site in 2026. The text preserves the context of the original publication.
If you want to make a choropleth/thematic map in Excel without programming perhaps conditional formatting is all you need. Here is how to do it:
- Select a few hundred columns and rows;
- Set width and height to 3 (more or less, depending on the resolutions you want);
- Set font size to 1;
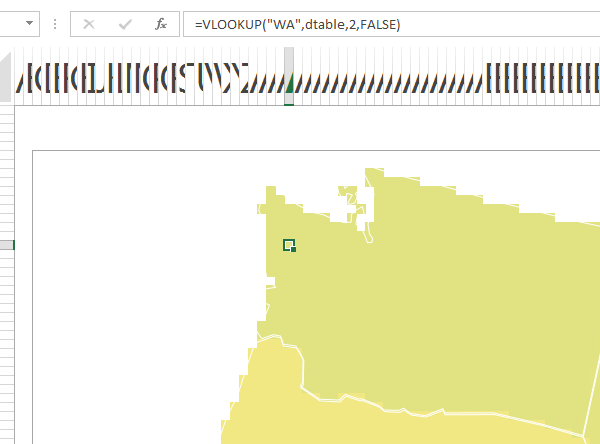
- Place a map file over those cells and make it transparent (if possible, use a WMF file) so that you can see the cells and the map borders;
- In a new sheet, add a table with all the regions and some random data;
- Get back to the first sheet and for each cell within a region enter a lookup function and change cell background (the lookup must include the region ID);
- Save your work and make a copy of this sheet;
- Select a rectangle around your map and add a border;
- Choose a conditional formatting rule for the entire rectangle;
- Clear the existing cell background color;
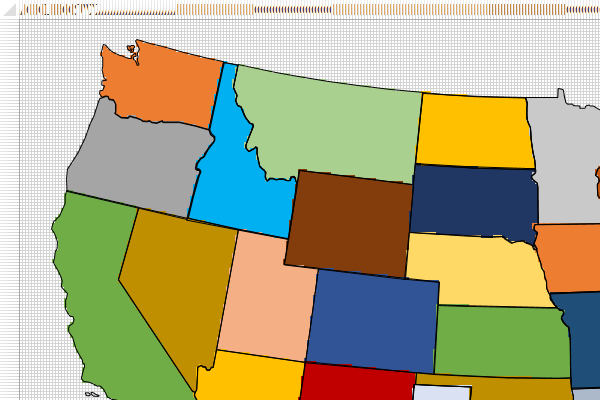
- You should see a colored map using the conditional formatting rule.
- Inside the rectangle, merge a few cells and create a legend (in this case, I used percentiles to automatically update it);
- You can delete the overlapping file, but the maps will look nicer with the borders;
- Use the camera tool to copy the map to a new sheet.
Here is the sheet for the example above:
Enjoy!
