
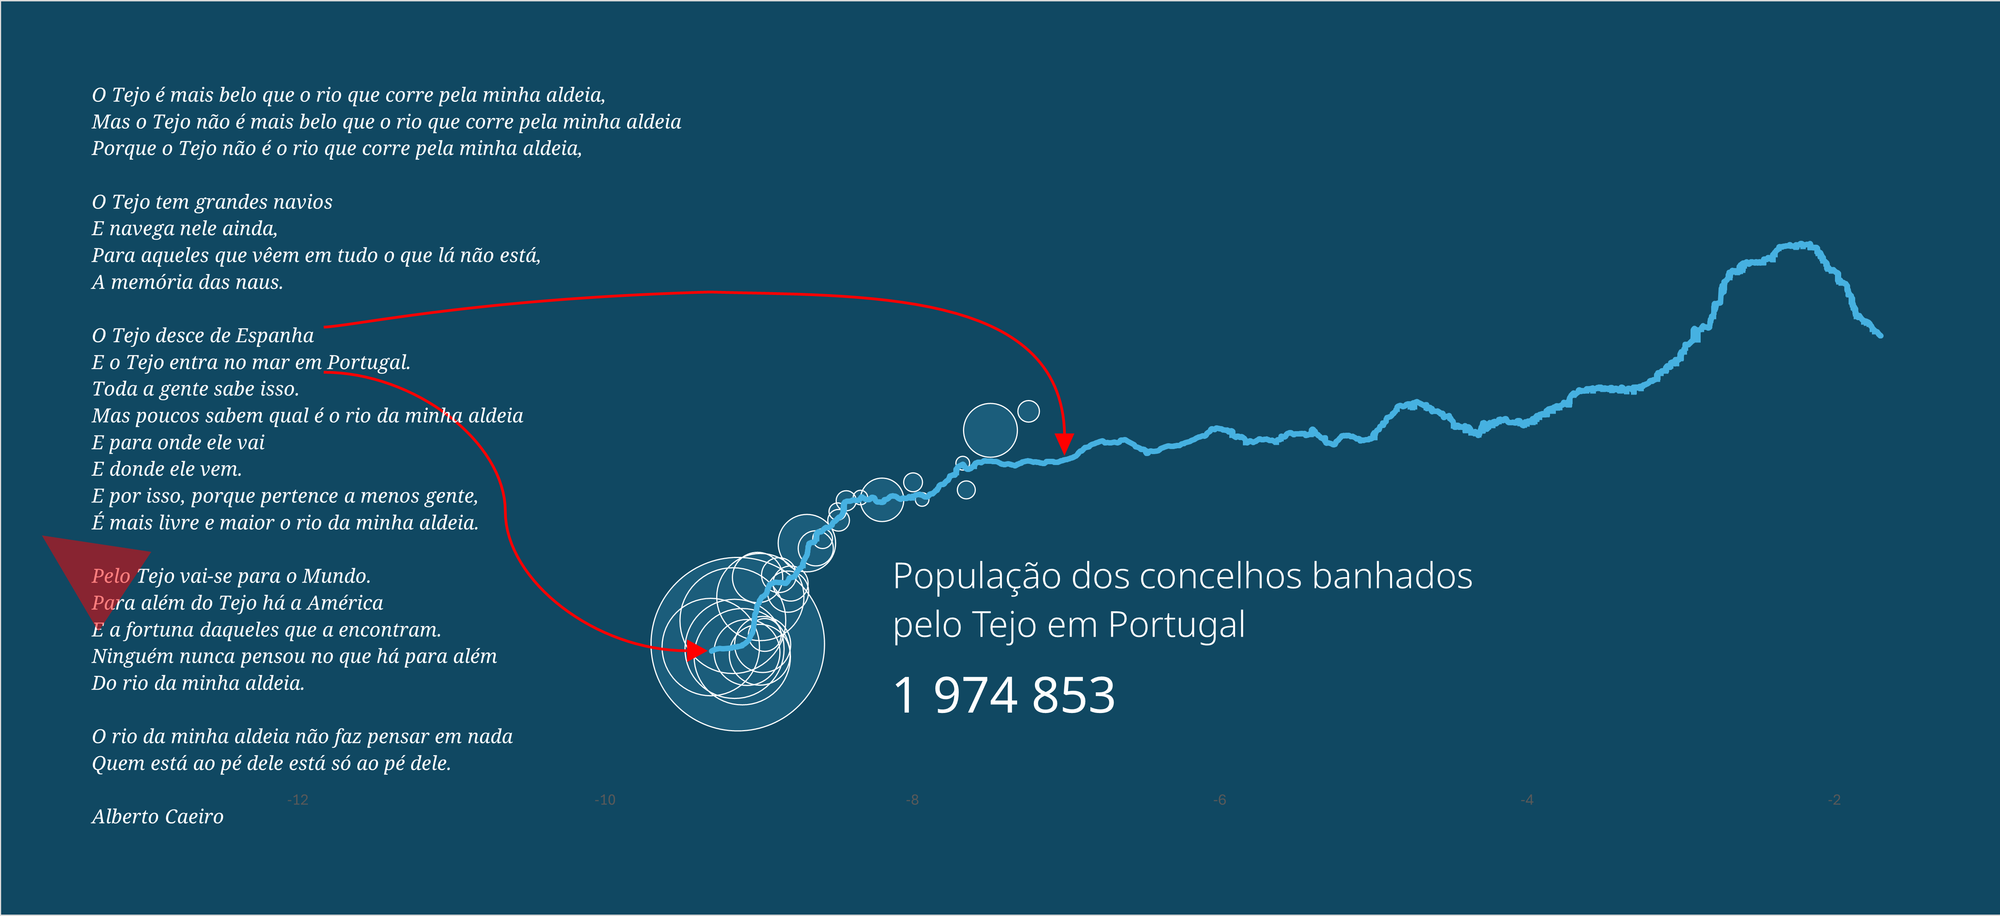
One day, I will take a journey along the entire length of the Tagus. Until that day comes, here is the next best thing: a chart about the Tagus River, featuring the population of the municipalities that border the river and the well-known poem by Alberto Caeiro.
How I made it
- The chart was created in Excel.
- The river coordinates were extracted from OpenStreetMap.
- The coordinates for the municipalities correspond to the City Hall locations and were also retrieved from OSM.
- Excel does not allow you to combine a bubble chart with a scatter plot. To work around this, I created two series within the bubble chart—one of which represents the river, with the bubble size set to a value of 1.
- I made the bubbles for the "River" series invisible and added a trendline with a moving average of 2. In practice, this gave me the line I was looking for.
