
Charts in our corner of the data visualization world must be, first and foremost, effective. And what is more effective, sober, and bureaucratic than a bar chart?
In reality, the concept of 'effectiveness' should go beyond data encoding: it must also include the ability to attract and retain attention. Bar charts tend to fail in both.
When we focus on extracting value from data and communicating better, a frequent byproduct is that the charts also become aesthetically more appealing and interesting.
A typical example
This is easy to demonstrate using a particularly poor chart, such as a 3D pie chart with exploded segments and gaudy colors. Let me provide a slightly more sophisticated example.
This chart from the Istat, the Italian national institute of statistics, displays the labor market participation of the population aged 15–64 in Italy, by sex and level of education. There is absolutely nothing extraordinary about it. On the contrary, it is hard to find anything more typical of how statistical agencies represent data visually. Bar charts are generally safe bets for the correct and effective visuals, as they don't force us to think too much about how we are going to communicate.
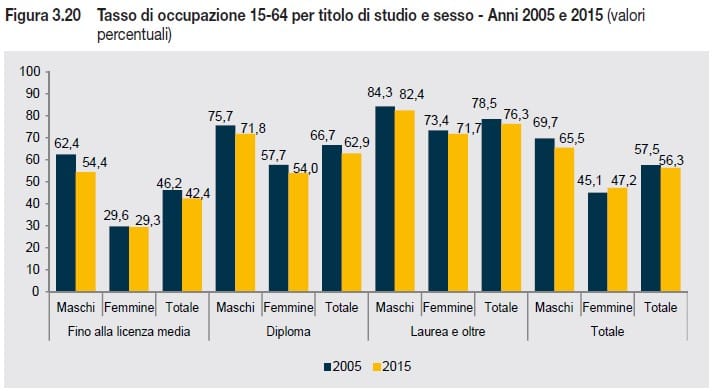
What is interesting about this chart is that it gives us vague impressions but few concrete insights. We realize how poorly it communicates only when we ask it specific questions that it struggles to answer, beyond the 2005–2015 comparison within each pair of columns. What was the trend by sex for each education level? Are there significant variations in the range? The data is there, and we can read it. But it’s something the chart tells me begrudgingly, and only because I asked. If I don't ask, I won't get any additional insights.
A thoughtful alternative
This chart is available in one of the course lessons as an alternative to bar charts, using the same data:

(Uma versão em Excel já está disponível na Biblioteca de Gráficos)
In this chart, the answers appear instantly as soon as we formulate the question:
- Yes, there is a decrease in total participation between 2005 and 2015.
- Yes, there is an education effect on participation (higher education, higher participation).
- Yes, the gap in participation by sex tends to narrow as the level of education increases.
- Yes, overall female participation increases, but it decreases when broken down by education level—and I don’t know how to explain that (it is easy to detect in this chart, but not in the other).
To be honest, when I designed this chart, I wasn't expecting such a vast difference in communicative power between the two. In fact, I hadn't realized just how bad the bar chart really was.
Beyond its obvious advantages, this chart could easily accommodate more years. One of the problems with bar charts is managing multiple series, which makes representing more data a significant challenge.
An indifference to the data
In a sense, the bar chart is the most bureaucratic of all charts. When well-designed, it is highly effective for comparing values. Much like bureaucracy, it can amaze us with its efficiency (yes, 'efficiency' and 'bureaucracy' in the same sentence sounds strange). But curiosity is always missing. And everything must fit the model.
The design of a chart often reveals a lack of curiosity and interest in what the data has to say, and how we choose to give it a voice. Sometimes we need a designer for that. However, for everyday tasks, the fundamental thing is to understand what we want to ask the data. In the bar chart above, the focus is on the individual value of each bar; in the alternative chart, the emphasis is on the analysis of differences, which seems to be a more relevant perspective. Once that perspective becomes clear, choosing the right design becomes much simpler.
Takeaways
O lema deste site, “Valorize os seus dados”, encontra aqui uma excelente aplicação: a escolhe de um tipo de gráfico mais adequado revela um valor insuspeito nos dados. Para não perder esse valor, há algumas ideias que podemos explorar:
- Decida o que quer valorizar: valores individuais vs. diferenças
- Escolha o desenho e tipo de gráfico que mais eficazmente comunica essa mensagem
- Evite legendas sempre que possível
- Se as séries são períodos temporais, tente colocá-las no eixo horizontal, não na legenda.
The motto of this site, 'Value your data,' finds an excellent application here: choosing a more suitable chart type reveals hidden value in the data. To ensure this value is not lost, here are some ideas to explore:
- Decide what you want to emphasize: individual values vs. differences.
- Choose the design and chart type that most effectively communicates that message.
- Avoid legends whenever possible.
- If it's a time series, try placing it on the horizontal axis rather than in a legend.
This is the type of reflection we develop in our Data Visualization Course: understanding how different graphical choices shape the information we can extract. Become a member of the Wisevis Academy and enhance your data visualization skills.
