I found this article in Visão magazine (oh, the irony), presenting the number of crimes recorded in 2004, 2014, 2019, and 2024 (I’ve blurred it slightly as the goal isn't to share the article itself).
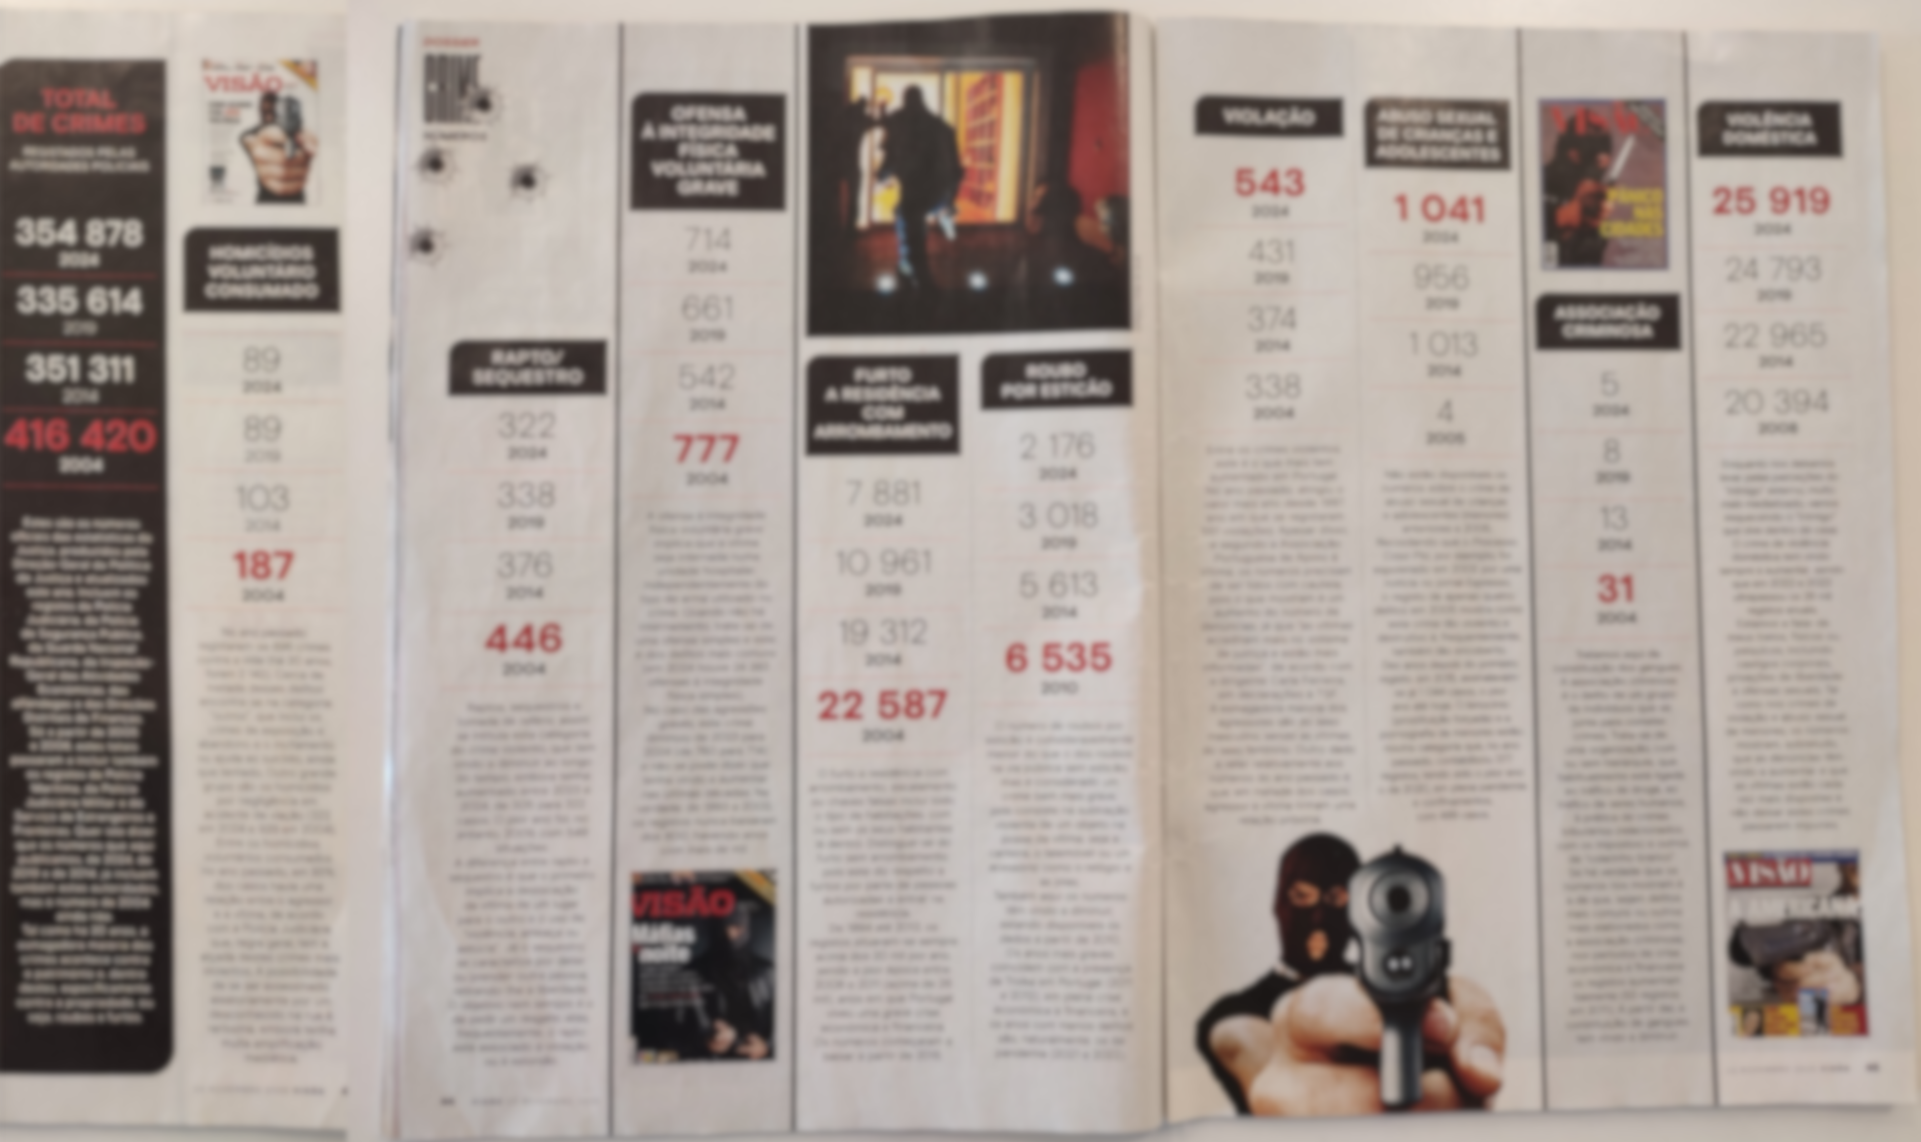
It never ceases to amaze me how, in Portugal, there is such a reluctance to use data visualization. Random figures are published instead of showing the complete time series, even when the data exists and would make it easier to understand the information in a more detailed way.
Here, I made a few small charts that could replace those numbers. Since the crime categories have very different magnitudes, I used 1994=100 as a baseline so they all share the same scale.
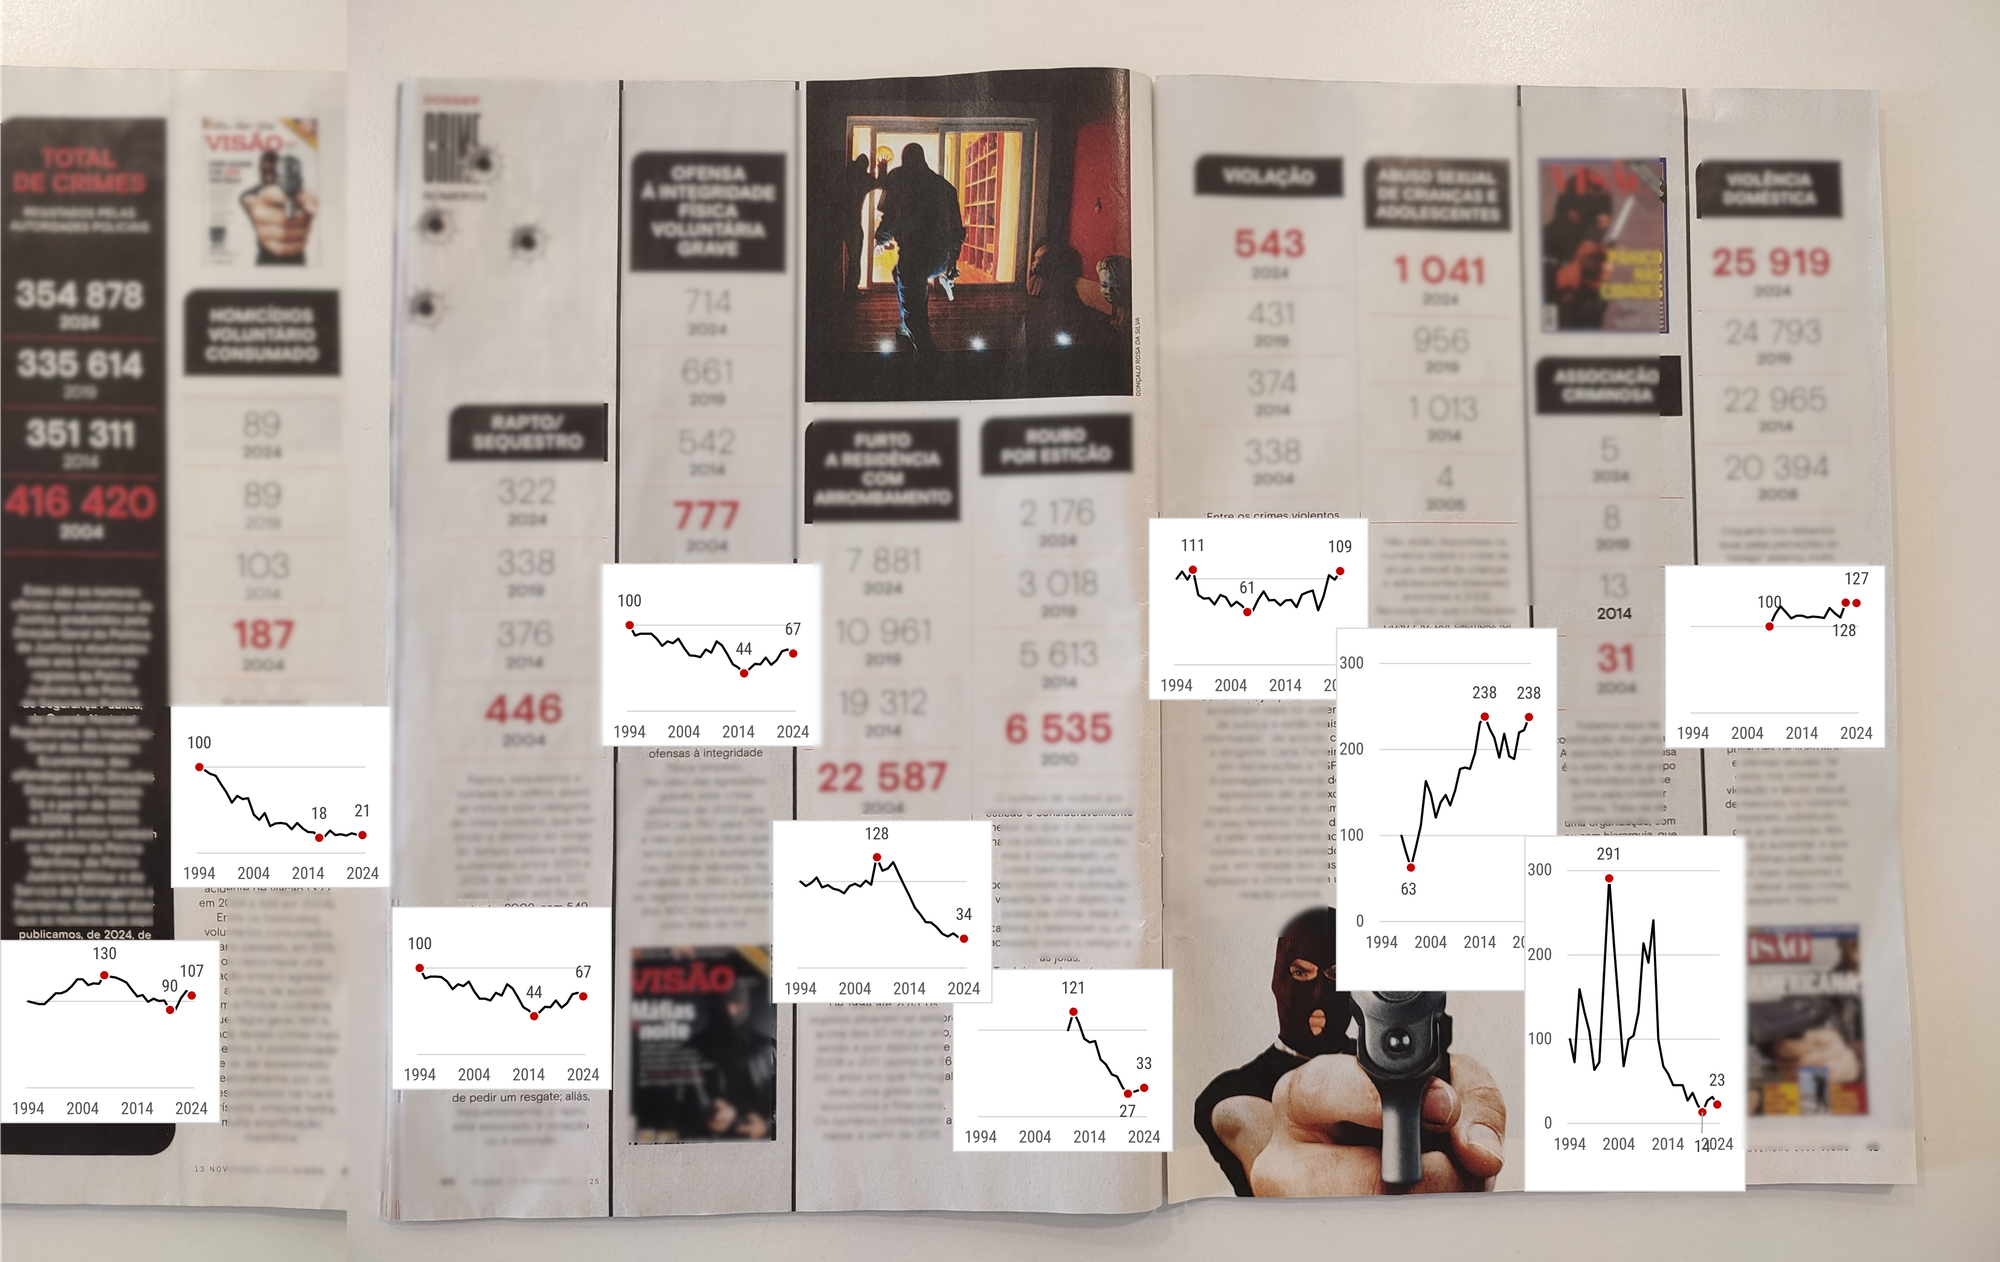
This doesn't seem to require more work than placing four numbers in each column, and it allows for a much clearer reading of how these crimes have evolved over the last 30 years.
Pro tip
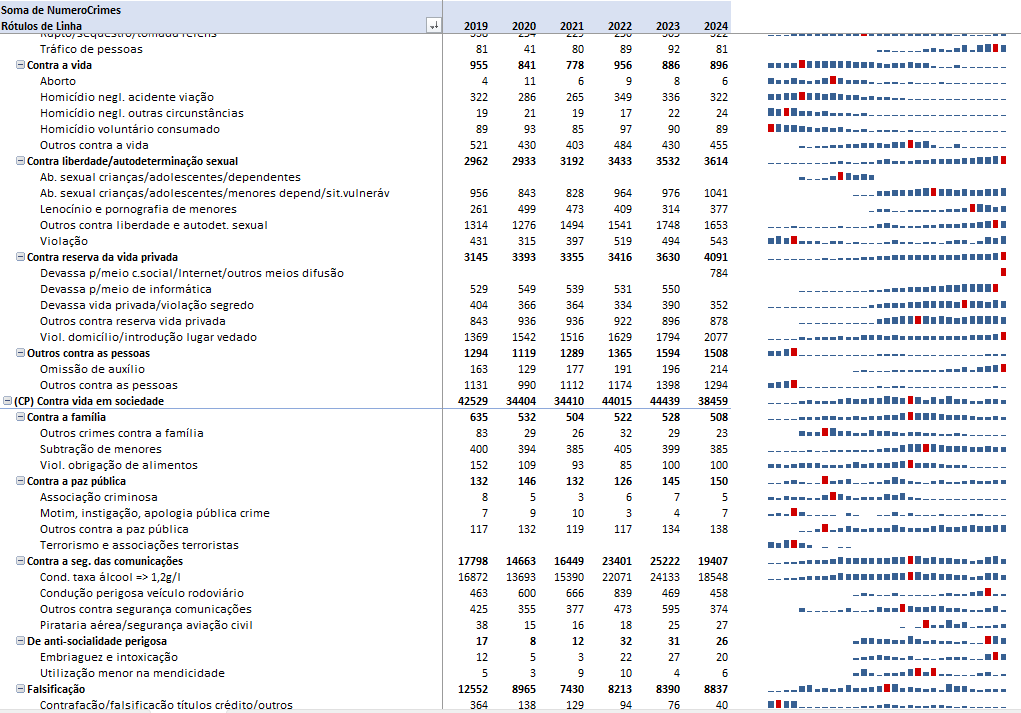
It’s easy to link an Excel file to the Ministry of Justice website and extract the figures. Then, you can create a pivot table with all the years in columns and the various crime levels and categories.
Next, add sparklines (small, line-height charts) to the right of the table, emphasizing the highest value. This allows for quickly identifying which types of crimes are increasing and which have gone out of fashion. It’s important to note that, generally, sparklines have their own individual axes, varying between their specific minimum and maximum. Therefore, they aren't comparable vertically, but the idea here is precisely to show the profile of each one for a quick evaluation.
This makes it very easy to observe variation across approximately 300 types of crimes. I’m certain there are great stories to be found in that table.